Category
page 1Charts

graph of a function
representation of a function as the set of pairs (x, f(x))
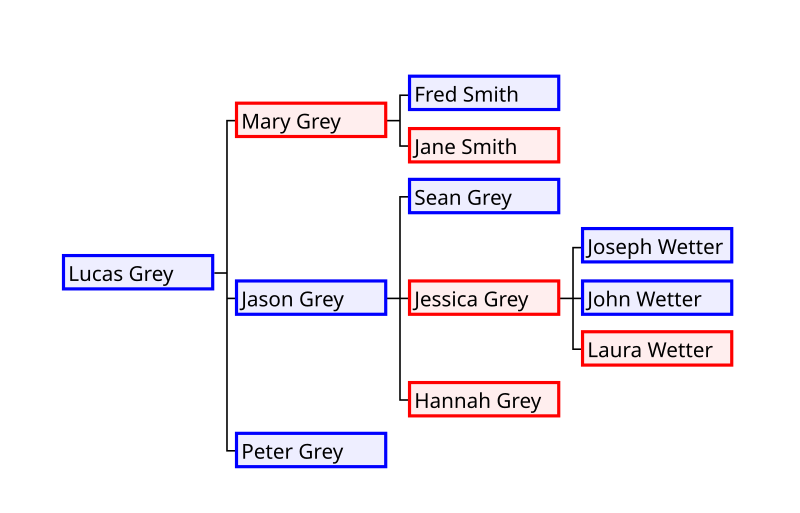
family tree
chart representing family relationships in a conventional tree structure

phase diagram
chart used to show conditions at which physical phases of a substance occur

Gantt chart
type of bar chart used for schedules and dependencies

nomogram
thumb|A typical parallel-scale nomogram. This example calculates the value of T when S = 7.30 and R = 1.17 are substituted into the equation. The isopleth crosses the scale for T at just under 4.65.

chart
class=skin-invert-image|thumb|A pie chart showing the composition of the 38th Parliament of Canada
Smith chart
graphical aid designed to assist in solving problems with transmission lines and matching circuits in radio engineering
Snellen chart
eye chart used to measure visual acuity

genogram
A genogram, also known as a family diagram, is a pictorial display of a person's position and ongoing relationships in their family's hereditary hierarchy. It goes beyond a traditional family tree by allowing the user to visualize social patterns and psychological factors that punctuate relationships, especially patterns that repeat over the generations.
radar chart
chart displaying multivariate data with values represented on axes starting from the same point
semi-log plot
plot that has one axis on a logarithmic scale and the other on a linear scale
burn down chart
diagram of the burn rate of tasks in project management to predict when a job will be completed
decade
unit of logarithmic frequency interval, corresponding to a ratio of 10 between the frequencies
International Phonetic Alphabet chart
phonetic symbol chart
lever rule
term in physics
Ragone chart
plot for comparing energy density of energy-storing devices
project network
diagram showing the order of activities
flow map
mix of maps and flow charts
Waterfall chart
kind of floating column bar chart
Chart.js
Chart.js is a free, open-source JavaScript library for data visualization, which supports eight chart types: bar, line, area, pie (doughnut), bubble, radar, polar, and scatter. Created by London-based web developer Nick Downie in 2013, now it is maintained by the community and is the second most popular JavaScript charting library on GitHub by the number of stars after D3.js, considered significantly easier to use though less customizable than the latter. Chart.js renders in HTML5 canvas and is widely covered as one of the best data visualization libraries. It is available under the MIT licens
bubble chart
chart
E chart
eye chart used to measure visual acuity
process decision program chart
technique designed to help prepare contingency plans, by identifying the consequential impact of failure on activity plans
plot
graphical technique for data sets
classification chart
LogMAR chart
eye chart