Category
page 1Signal processing

code
In communications and information processing, code is a system of rules to convert information—such as a letter, word, sound, image, or gesture—into another form, sometimes shortened or secret, for communication through a communication channel or storage in a storage medium. An early example is an invention of language, which enabled a person, through speech, to communicate what they thought, saw, heard, or felt to others. But speech limits the range of communication to the distance a voice can carry and limits the audience to those present when the speech is uttered. The invention of writing,

signal
thumb|right|In The Signal by William Powell Frith, a woman sends a signal by waving a white handkerchief.

periodic function
function that repeats its values in regular intervals or periods

signal processing
models and analyzes data representations of physical events
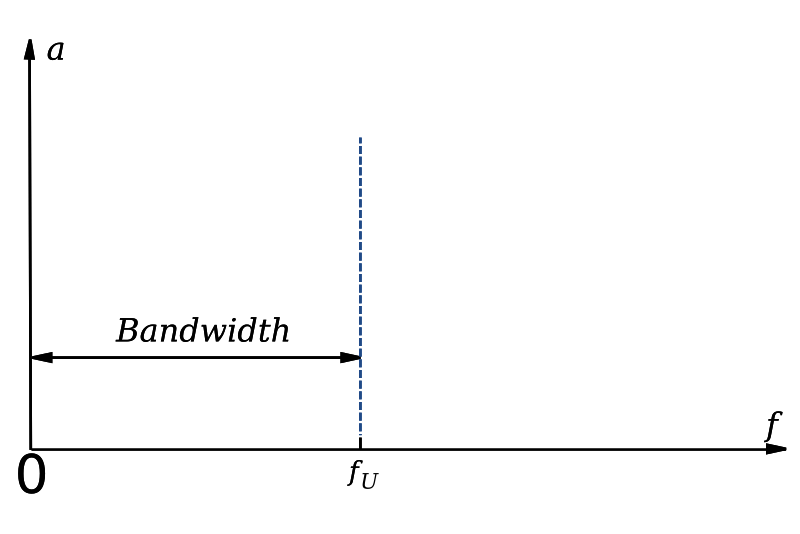
signal bandwidth
difference between the upper and lower frequencies passed by a filter, communication channel, or signal spectrum
sampling
measurement of a signal at discrete time intervals
negative feedback
stability mechanism which occurs when some function of the output of a system, process, mechanism is fed back in a manner that tends to reduce the fluctuations in the output, whether caused by changes in the input or by other disturbances
quantization
process of mapping a continuous set to a countable set
pulse-width modulation
modulation technique

autocorrelation
thumb|300px|right|Above: A plot of a series of 100 random numbers concealing a sine function. Below: Its [[correlogram plots the autocorrelation function (ACF) of the series on the y-axis for every lag on the x-axis. Peaks occur at lags where the series is highly correlated with itself. Peaks to the right of the initial peak at lag 0 indicate periodicity in the series and help estimate the concealed sine's period.]]
thumb|400px|Visual comparison of convolution, cross-correlation, and autocorrelation. For the operations involving function , and assuming the height of is 1.0, the value of the re
low-pass filter
filter that passes signals with a frequency lower than a certain cutoff frequency, and attenuates signals with higher frequencies
frequency response
quantitative measure of the output spectrum of a system or device in response to a stimulus

spectrogram
thumb|upright=1.35|Spectrogram of the spoken words "nineteenth century". Frequencies are shown increasing up the vertical axis, and time on the horizontal axis. The legend to the right shows that the color intensity increases with the density.
thumb|upright=1.35|A 3D spectrogram: The RF spectrum of a battery charger is shown over time
spectrum analyzer
Instrument that measures the magnitude of an input signal versus frequency within the full frequency range of the instrument
Bode plot
graph of the frequency response of a linear system presented in logarithmic scale
optical spectrometer
spectrometer for visible light

aliasing
In digital signal processing, aliasing is a phenomenon that a reconstructed signal from samples of the original signal contains low frequency components that are not present in the original one. This is caused when, in the original signal, there are components at frequency exceeding a certain frequency called Nyquist frequency, f_s / 2, where f_s is the sampling frequency (undersampling). This is because typical reconstruction methods use low frequency components while there are a number of frequency components, called aliases, which sampling result in the identical sample. It also often refer
sinc function
special mathematical function defined as sin(x)/x

wavelet
A wavelet is a wave-like oscillation with an amplitude that begins at zero, increases or decreases, and then returns to zero one or more times. Wavelets are termed a "brief oscillation". A taxonomy of wavelets has been established, based on the number and direction of its pulses. Wavelets are imbued with specific properties that make them useful for signal processing.
thumb|Seismic wavelet
dynamic range
ratio between the largest and smallest values that a certain quantity can assume, often used in the context of signals
data acquisition
sum of methods of simultaneous or sequential time measurement and counting for measurable or quantifiable data and groups of contiguous data

cross-correlation
thumb|400px|Visual comparison of convolution, cross-correlation and [[autocorrelation. For the operations involving function , and assuming the height of is 1.0, the value of the result at 5 different points is indicated by the shaded area below each point. Also, the vertical symmetry of is the reason f*g and f \star g are identical in this example.]]
audio signal processing
electronic manipulation of audio signals

heterodyne
thumb|upright=1.5|Frequency mixer symbol used in schematic diagrams. Here, the input signal consists of signals at multiple frequencies, which are mixed to create the output signal that are signals at new frequencies.
Nyquist stability criterion
Nyquist stability criterion in control systems
spectral density
relative importance of certain frequencies in a composite signal
stationary process
stochastic process whose unconditional joint probability distribution does not change when shifted in time
argument
angle of complex number about real axis
linear time-invariant system
mathematical model of system that produces an output signal from any input signal subject to the constraints of linearity and time-invariance
pulse
concept in signal processing

baseband
thumb|Spectrum of a baseband signal, energy E per unit frequency as a function of frequency f. The total energy is the area under the curve.

deconvolution
thumb|right|Before and after deconvolution of an image of the lunar crater Copernicus (lunar crater)|Copernicus using the Richardson-Lucy algorithm.
detection theory
analyzed the detection of difficult to detect signals and provides a measure of the quality of the detection
autoregressive model
representation of a type of random process
Hilbert transform
integral transform and linear operator that takes a function of a real variable and produces another function of a real variable with a 90 degree phase shift
short-time Fourier transform
discrete Fourier transform with short overlapping windows
estimation theory
branch of statistics to estimate models based on measured data
speech processing
study of speech signals and the processing methods of these signals
pure tone
sound with a sinusoidal waveform
analog signal processing
type of signal processing
filter
signal processing device or process that removes unwanted components or features from a signal, or enhances wanted ones, or both

Chirp
thumb|upright=1.3|A linear chirp waveform; a sinusoidal wave that increases in frequency linearly over time
Nyquist plot
plot

beamforming
thumb | right
Comb filter
signal processing filter
wavelet transform
mathematical technique used in data compression and analysis
Routh–Hurwitz stability criterion
Mathematic test in control system theory
downsampling
process of reducing the sampling rate of a signal
Dirac comb
periodic distribution ("function") of "point-mass" Dirac delta sampling
time-invariant system
mathematical model
median filter
non-linear digital filtering technique to remove noise

cepstrum
In Fourier analysis, the cepstrum (; plural cepstra, adjective cepstral) is the result of computing the inverse Fourier transform (IFT) of the logarithm of the estimated signal spectrum. The method is a tool for investigating periodic structures in frequency spectra. The power cepstrum has applications in the analysis of human speech.
step response
time behavior
Stochastic resonance
signal boosting phenomenon using white noise

pulse-density modulation
form of modulation used in analog to digital conversions

emphasis
the process of boosting noise-prone parts of the signal before transmission (and reversing upon receival)
Zero-order hold
model of signal reconstruction in digital-to-analog (DAC) converters

signal-flow graph
a specialized flow graph, a directed graph in which nodes represent system variables, and branches (edges, arcs, or arrows) represent functional connections between pairs of nodes
Wiener–Khinchin theorem
spectral decomposition theorem of stationary processes' autocorrelations
pulse compression
signal processing technique