Category
page 1Statistical deviation and dispersion
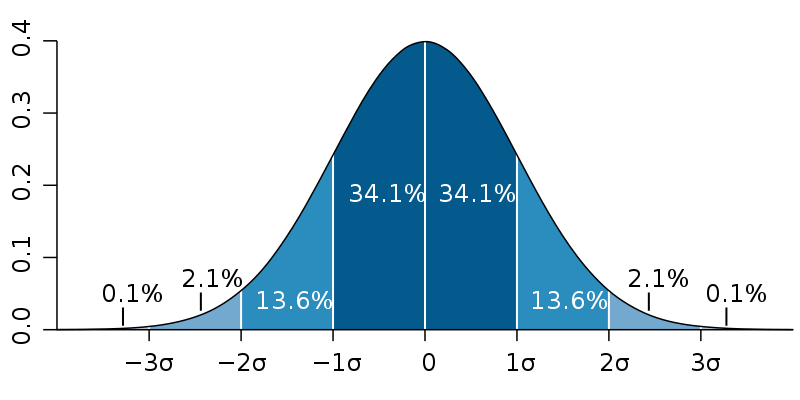
standard deviation
dispersion of the values of a random variable around its expected value

variance
thumb|400px|right|Example of samples from two populations with the same mean but different variances. The red population has mean and variance (), while the blue population has mean and variance ().

coefficient of skewness
thumb|200px|Example distribution with positive skewness. The data presented is from experiments on wheat grass growth.
root mean square
statistic; square root of the mean of the squares

statistical dispersion
statistical property quantifying how much a collection of data is spread out
standard error
statistical property
engineering tolerance
permissible limit(s) of variation in an engineered component or system
coefficient of variation
relative standard deviation: standard deviation divided by the mean
range
difference of largest and smallest order statistic

kurtosis
Kurtosis (from ( or ), meaning 'curved, arching') refers to the degree of tailedness in the probability distribution of a real-valued, random variable in probability theory and statistics. Similar to skewness, kurtosis provides insight into specific characteristics of a distribution. Various methods exist for quantifying kurtosis in theoretical distributions, and corresponding techniques allow estimation based on sample data from a population. Different measures of kurtosis can yield varying interpretations.
margin of error
statistic expressing the amount of random sampling error in a survey's results
heteroscedasticity
statistical property in which some subpopulations in a collection of random variables have different variabilities from others
market risk
Risks arising from movements in market variables
average absolute deviation
summary statistic of variability
mean squared error
average of the squares of the errors between estimated and actual values
full width at half maximum
concept in statistics and wave theory
coefficient of determination
indicator for how well data points fit a line or curve
errors and residuals
measures of deviation of an observed value from its theoretical value
Bollinger Bands
type of statistical chart characterizing the prices and volatility of a financial instrument or commodity

negentropy
In information theory and statistics, negentropy is used as a measure of distance to normality. It is also known as negative entropy or syntropy.

Variogram
thumb|Schematisation of a variogram. The points represent the measured data points (observed) and the curve represents the model function used (empirical). Range stands for the range sought, sill for the plateau value reached at maximum range, nugget for the nugget effect.
propagation of uncertainty
effect of variables' uncertainties (or errors, more specifically random errors) on the uncertainty of a function based on them
central moment
moment of a random variable minus its mean
deviation
measure of difference between the observed value of a variable and some other value, often that variable's mean
Bessel's correction
multiplicative correction for an estimator for variance, such that it becomes unbiased

root-mean-square deviation
statistical measure
variance inflation factor
measure of collinearity in statistical regression models
Otsu's method
automatic image thresholding method
standardized moment
normalized central moments
median absolute deviation
median of the absolute deviation from the median; a robust measure of the variability of a univariate sample of quantitative data
mean absolute error
measure of difference between two continuous variables
Fano factor
statistics concept
law of total variance
theorem
mean absolute difference
measure of statistical dispersion
algorithms for calculating variance
important algorithms in numerical statistics
Index of dispersion
normalized measure of the dispersion of a probability distribution
Goldfeld–Quandt test
test proposed by Stephen Goldfeld and Richard Quandt
studentized residual
Kind of ratio
deviance
quality-of-fit statistic for a model that is often used for statistical hypothesis testing;a generalization of the idea of using the sum of squares of residuals in ordinary least squares to cases where model-fitting is achieved by maximum likelihood