File:Standard_deviation_diagram.svg · Wikimedia Commons · See Wikimedia Commons
standard deviation
dispersion of the values of a random variable around its expected value
AI overview
Standard deviation measures how spread out the values in a group of data are from the average—essentially telling you whether the numbers cluster tightly together or scatter widely. It matters because it helps you understand whether an average is truly representative of your data or whether there's a lot of variation hiding behind that single number.
AI-generated from the Wikipedia summary — may contain errors.
Wikidata facts
- Image
- Standard deviation diagram.svg
Show 3 more facts
- Commons category
- Standard deviation
- Commons gallery
- Standard deviation
- short name
- SD
via Wikidata · CC0
~40 min read
Article
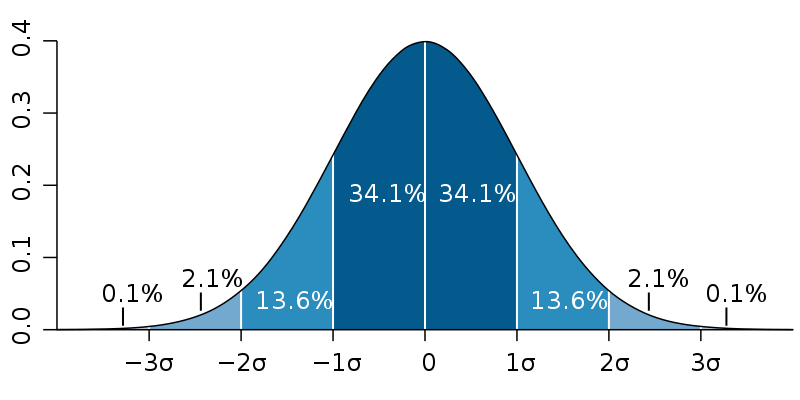
A plot of normal distribution (or bell-shaped curve) where each band has a width of 1 standard deviation–See also: 68–95–99.7 rule. Cumulative distribution function of a normal distribution with expected value 0 and standard deviation 1
In statistics, the standard deviation is a measure of the amount of variation of the values of a variable about its (arithmetic) average. A low standard deviation indicates that the values of a set tend to be close to their average, while a high standard deviation indicates that the values are spread out over a wider range. Standard deviation may be abbreviated SD or std dev, and is most commonly represented in mathematical texts and equations by the lowercase Greek letter σ (sigma).