
Image by LTDatEHU on Pixabay · Pixabay License
knowledge graph
Sign in to saveAlso known as concept of knowledge graph, knowledge graphs
information repository structured as a graph of entities and relationships; used by search engines and AI systems for entity resolution, retrieval composition, and knowledge representation
Described at
What's the Difference Between an Ontology and a Knowledge Graph? - Enterprise Knowledge
Ontologies are generalized semantic data models, while a knowledge graph is what we get when we leverage that model and apply it to instance data.
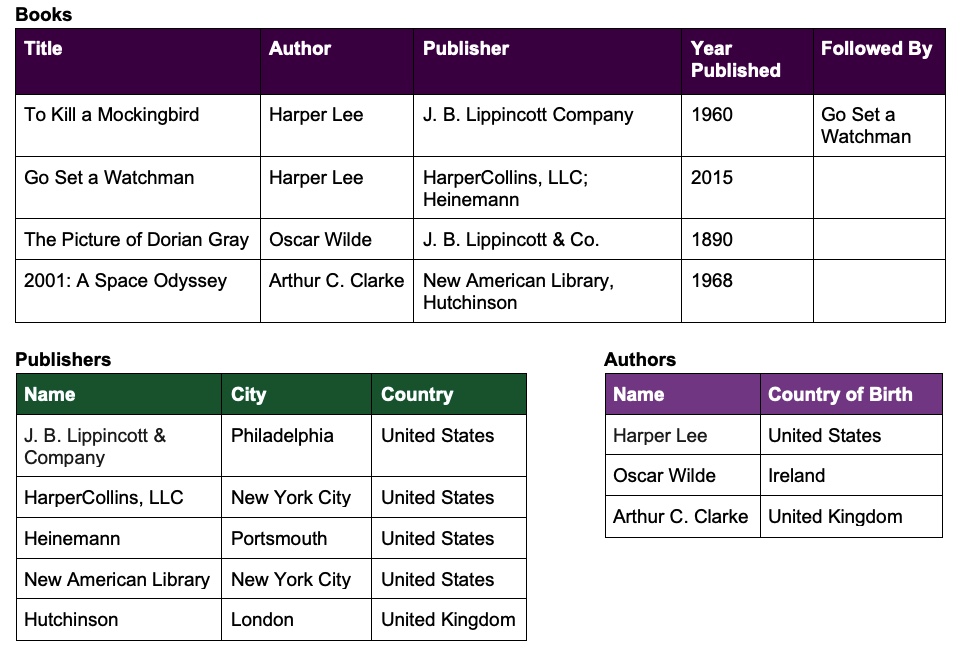
enterprise-knowledge.com →As semantic applications become increasingly hot topics in the industry, clients often come to EK asking about ontologies and knowledge graphs. Specifically, they want to know the differences between the two. Are ontologies and knowledge graphs the same thing? If not, how are they different? What is the relationship between the two? In this blog, I’ll walk you through both ontologies and knowledge graphs, describing how they’re different and how they work together to organize large amounts of data and information. Ontologies are semantic data models that define the types of things that exist in our domain and the properties that can be used to describe them. Ontologies are generalized data models, meaning that they only model general types of things that share certain properties, but don’t include information about specific individuals in our domain. For example, instead of describing your dog, Spot, and all of his individual characteristics, an ontology should focus on the general concept of dogs , trying to capture characteristics that most/many dogs might have. Doing this allows us to reuse the ontology to describe additional dogs in the future. First we want to identify our classes (the unique types of things that are in the data). This sample data appears to capture information about books , so that’s a good candidate for a class. Specifically, the sample data captures certain types of things about books, such as authors and publishers. Digging a little deeper, we can see our data also captures information about publishers and authors , such as their locations . This leaves us with four classes for this example: Next, we need to identify relationships and attributes (for simplicity, we can consider both relationships and attributes as properties). Using the classes that we identified above, we can look at the data and start to list all of the properties we see for each class. For example, looking at the book class, some properties might be: Some of these properties are relationships that connect two of our classes. For example, the property “ books have authors ” is a relationship that connects our book class and our author class. Other properties, such as “ books are published on a date,” are attributes, describing only one class, instead of connecting two classes together. It’s important to note that these properties might apply to any given book, but they don’t necessarily have to apply to every book. For example, many books don’t have sequels. That’s fine in our ontology, because we just want to make sure we capture possible properties that could apply to many, but not necessarily all, books. If we do this with all of our data, we will eventually wind up with a graph that has our data encoded using our ontology. Using this knowledge graph, we can view our data as a web of relationships, instead of as separate tables, drawing new connections between data points that we would otherwise be unable to understand. Specifically, using SPARQL , we can query this data, using inferencing, letting our knowledge graph make connections for us that weren’t previously defined. As you can see from the example above, a knowledge graph is created when you apply an ontology (our data model) to a set of individual data points (our book, author, and publisher data). In other words: Ready to get started? Check our ontology design and knowledge graph design best practices, and contact us if you need help beginning your journey with advanced semantic data models.
Excerpt from a page describing this subject · 9,021 chars · not written by Vinony
Wikidata facts
- Image
- Wikidata knowledge graph - Christine Choy.png
Show 7 more facts
- different from
- Google Knowledge Graph
- studied by
- computer science
- inception
- 1972-00-00
- uses
- ontology
- described at URL
- www.fiz-karlsruhe.de/de/nachricht/wissensgraphen-ihre-bedeutung-der-digitalen-welt-von-heute
- Commons category
- Knowledge graphs
Sources (3)
via Wikidata · CC0