Category
page 1Diagrams

Hertzsprung–Russell diagram
scatter plot of stars showing the relationship between the stars' absolute magnitudes (luminosities or brightness) versus their effective temperatures (stellar classifications or colour)
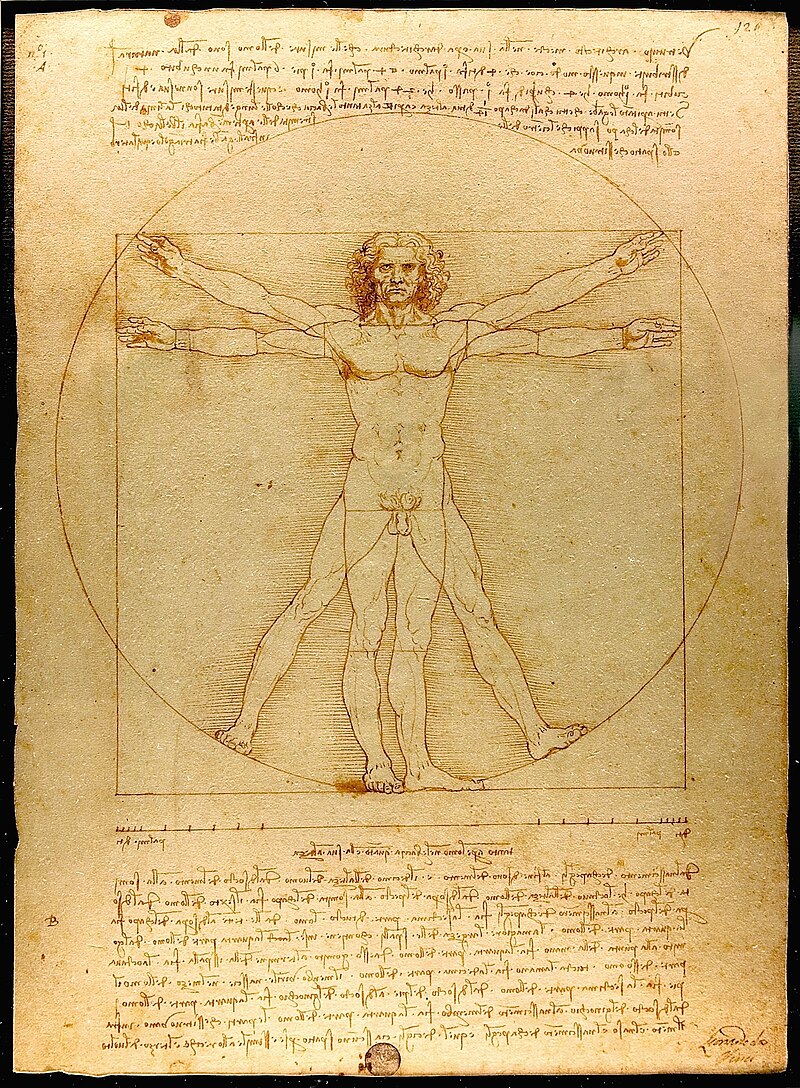
Vitruvian Man
drawing by Leonardo da Vinci
Unified Modeling Language
software system design modeling tool

flowchart
thumb|255px|A simple flowchart representing a process for dealing with a non-functioning Light fixture|lamp

diagram
A diagram is a symbolic representation of information using visualization techniques. Diagrams have been used since prehistoric times on walls of caves, but became more prevalent during the Enlightenment. Sometimes, the technique uses a three-dimensional visualization technique which then become projected onto a two-dimensional surface.

phase diagram
chart used to show conditions at which physical phases of a substance occur
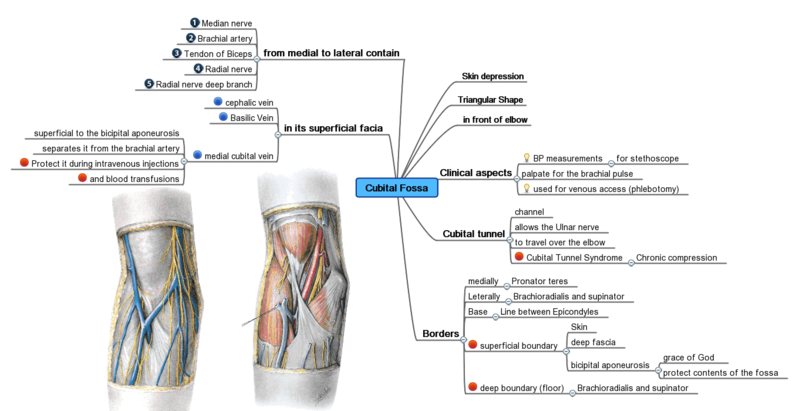
mind map
diagram to visually organize information
Feynman diagram
pictorial representations of the behavior of subatomic particles

nomogram
thumb|A typical parallel-scale nomogram. This example calculates the value of T when S = 7.30 and R = 1.17 are substituted into the equation. The isopleth crosses the scale for T at just under 4.65.
concept map
diagram showing relationships among concepts

cladogram
thumb|250px|A horizontal cladogram, with the root to the left
thumb|250px|Two vertical cladograms, the root at the bottom
thematic map
map specifically designed to show a particular theme connected with a specific geographic area
organizational chart
diagram that shows the structure of an organization and the relationships and relative ranks of its parts and positions/jobs
commutative diagram
collection of maps in which all map compositions starting from the same set and ending with the same set give the same result
program evaluation and review technique
statistical tool, used in project management
Minkowski diagram
graph of space and time in special relativity
wind rose
graphic tool used by meteorologists to give a succinct view of how wind speed and direction are typically distributed at a particular location
state diagram
diagram used in computer engineering and computer science
circuit diagram
graphical representation of an electrical circuit (network)
block diagram
diagram of a system in which the principal parts or functions are represented by blocks connected by lines that show the relationships of the blocks
data-flow diagram
graphical representation of the "flow" of data through an information system

connectome
thumb|Nerve tract|White matter tracts within a human brain, as visualized by [[MRI tractography]]
thumb|Rendering of a group connectome based on 20 subjects. Anatomical fibers that constitute the white matter architecture of the human brain are visualized color-coded by traversing direction (xyz-directions mapping to RGB colors respectively). Visualization of fibers was done using TrackVis software.

cartogram
thumb|upright=1.5|Mosaic cartogram showing the distribution of the global population.
Each of the 15,266 pixels represents the home country of 500,000 people – cartogram by Max Roser for [[Our World in Data]]
Business Process Model and Notation
graphical representation for specifying business processes
free body diagram
diagram where all forces on a body or part of a system are drawn
pressure–volume diagram
diagram in thermodynamics, ploting pressure versus volume, typically used for thermodynamic processes
parallelogram of force
addition of vectors
Topic Maps
knowledge organization system
piping and instrumentation diagram
detailed diagram showing piping, process equipment, instrumentation and control devices; used in in process industry
ternary plot
barycentric plot on three variables
Penrose diagram
two-dimensional diagram that captures the causal relations between different points in spacetime
binary decision diagram
data structure
spin network
graph whose edges are labelled with irreducible representations of a compact Lie group and whose vertices are associated with intertwiners of the edge representations adjacent to it
C4 model
lean graphical notation technique for modelling architecture of software systems
Jablonski diagram
diagram representing the electronic states of a molecule and the transitions between them
isothermal transformation diagram
plot of temperature versus time

schematic
A schematic, or schematic diagram, is a designed representation of the elements of a system using abstract, graphic symbols rather than realistic pictures. A schematic usually omits all details that are not relevant to the key information the schematic is intended to convey, and may include oversimplified elements in order to make this essential meaning easier to grasp, as well as additional organization of the information.
process flow diagram
diagram indicating general flow of plant processes and equipment; typically used to show major relationships in chemical and process engineering
kinematic chain
assembly of rigid bodies connected by joints to provide constrained motion that is the mathematical model for a mechanical system
function block diagram
graphical language for PLC design
constellation diagram
means of representing a modulation scheme in digital communications
phase portrait
geometric representation
thermodynamic diagrams
diagram showing the thermodynamic states of a material
area chart
type of chart
bond graph
graphical description of a physical dynamic system

Cremona diagram
Diagram in mechanics
syntax diagram
visual description of context-free grammar

specification and description language
ITU-specified system description language

Surya Majapahit
Nassi–Shneiderman diagram
diagram used to visualize the structure of a computer program
lever rule
term in physics
Jackson structured programming
Computer programming method
shear and moment diagram
structural design tool
one-line diagram
simplified notation for representing a three-phase power system
J curve
time path of a country’s trade balance following a devaluation or depreciation of its currency, under a certain set of assumptions

Planogram
350px|thumb|right|Example of a planogram featuring textile products
galaxy color–magnitude diagram
diagram showing the relationship between absolute magnitude and mass of galaxies
Template:ChartPalette
Wikipedia template
pedigree chart
diagram showing the occurrence and appearance or phenotypes of a particular gene or organism, in generations
Eadie–Hofstee diagram
graph of enzyme kinetics