AI overview
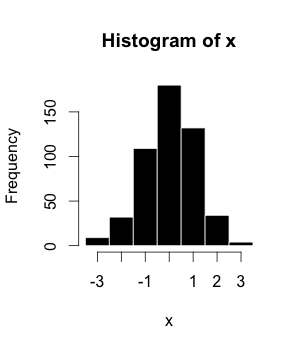
A histogram is a type of chart that shows how often different values appear in a set of data by dividing the data into groups (called bins) and displaying the frequency of each group as a bar. Histograms are useful because they let you quickly see patterns in data, like whether values tend to cluster in certain ranges or how the data is distributed overall.
AI-generated from the Wikipedia summary — may contain errors.
Wikidata facts
- Image
- Histogramme taille.svg
via Wikidata · CC0
Article · Italiano
L'istogramma è la rappresentazione grafica (diagramma) di una distribuzione in classi di un carattere continuo.
Abstract from DBpedia / Wikipedia · CC BY-SA