File:Example_histogram.png · Wikimedia Commons · See Wikimedia Commons
AI overview
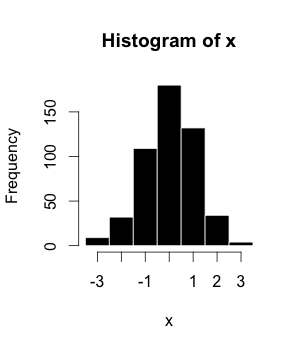
A histogram is a type of chart that shows how often different values appear in a set of data by dividing the data into groups (called bins) and displaying the frequency of each group as a bar. Histograms are useful because they let you quickly see patterns in data, like whether values tend to cluster in certain ranges or how the data is distributed overall.
AI-generated from the Wikipedia summary — may contain errors.
Wikidata facts
- Subclass of
- bar chart
- Part of
- statistics
- Depicts
- probability distribution
- Image
- Histogramme taille.svg
Show 6 more facts
- maintained by WikiProject
- WikiProject Mathematics
- uses
- data binning
- Commons category
- Histograms
- Stack Exchange tag
- stackoverflow.com/tags/histogram
- Commons gallery
- Histogram
- facet of
- statistics
via Wikidata · CC0