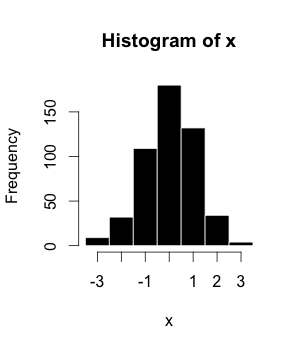
File:Example_histogram.png · Wikimedia Commons · See Wikimedia Commons
ヒストグラム
Sign in to savethumb|In this histogram, height is divided into bins of equal width (5 feet)
A histogram is a type of chart that shows how often different values appear in a set of data by dividing the data into groups (called bins) and displaying the frequency of each group as a bar. Histograms are useful because they let you quickly see patterns in data, like whether values tend to cluster in certain ranges or how the data is distributed overall.
AI-generated from the Wikipedia summary — may contain errors.
Wikidata facts
- Subclass of
- bar chart
- Part of
- statistics
- Depicts
- probability distribution
- Image
- Histogramme taille.svg
Show 6 more facts
- maintained by WikiProject
- WikiProject Mathematics
- uses
- data binning
- Commons category
- Histograms
- Stack Exchange tag
- stackoverflow.com/tags/histogram
- Commons gallery
- Histogram
- facet of
- statistics
via Wikidata · CC0
Article · 日本語
ヒストグラム(英語: histogram)とは、縦軸に度数、横軸に階級をとった統計グラフの一種で、データの分布状況を視覚的に認識するために主に統計学や数学、画像処理等で用いられる。柱状図、柱状グラフ、度数分布図ともいう。 工業分野では、パレート図、チェックシート、管理図、特性要因図、、散布図と並んで、品質管理のためのQC七つ道具として知られている。
Abstract from DBpedia / Wikipedia · CC BY-SA