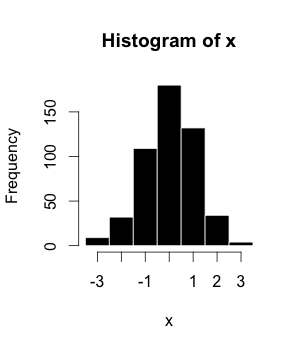
File:Example_histogram.png · Wikimedia Commons · See Wikimedia Commons
histogram
Sign in to saveGrafische weergave van frequentieverdeling van data
A histogram is a type of chart that shows how often different values appear in a set of data by dividing the data into groups (called bins) and displaying the frequency of each group as a bar. Histograms are useful because they let you quickly see patterns in data, like whether values tend to cluster in certain ranges or how the data is distributed overall.
AI-generated from the Wikipedia summary — may contain errors.
Wikidata facts
- Subclass of
- bar chart
- Part of
- statistics
- Depicts
- probability distribution
- Image
- Histogramme taille.svg
Show 6 more facts
- maintained by WikiProject
- WikiProject Mathematics
- uses
- data binning
- Commons category
- Histograms
- Stack Exchange tag
- stackoverflow.com/tags/histogram
- Commons gallery
- Histogram
- facet of
- statistics
via Wikidata · CC0
Article · Nederlands
Een histogram of kolommendiagram is de grafische weergave van de frequentieverdeling van in klassen gegroepeerde data, afkomstig uit een continue kansverdeling. Dit diagram toont kolommen met oppervlakte ter grootte van de (relatieve) frequenties opgericht boven de klassen. Een histogram geeft een beeld van de kansdichtheid waaruit de data afkomstig zijn. Een histogram is de tegenhanger van een staafdiagram bij discrete verdelingen.
Abstract from DBpedia / Wikipedia · CC BY-SA