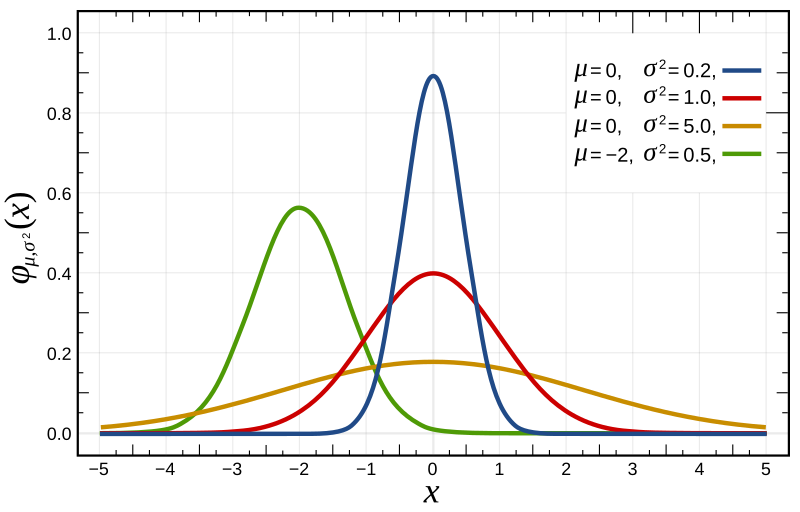
File:Normal_Distribution_PDF.svg · Wikimedia Commons · See Wikimedia Commons
توزيع احتمالي طبيعي
Sign in to saveAlso known as Gaussian distribution, bell curve
probability distribution
A normal distribution is a bell-shaped curve that describes how many random events or measurements cluster around an average value, with fewer occurrences at the extremes. It matters because many natural phenomena—like heights, test scores, and measurement errors—tend to follow this pattern, making it a fundamental tool for understanding and predicting real-world data.
AI-generated from the Wikipedia summary — may contain errors.
In the Vinony graph
Within Vinony's link graph, توزيع احتمالي طبيعي is referenced by 1,521 other articles, and connects out to probability distribution, independent and identically distributed random variables and Pierre-Simon Laplace.
It is catalogued under topics including Conjugate prior distributions, Continuous distributions and Exponential family distributions.
Its subject is documented across 74 Wikipedia language editions.
Research
130,632 papers- The normal distribution of the hypoxic ventilatory response and methodological impacts: a meta-analysis and computational investigation.The Journal of physiology · 2023Oeung B, Pham K, Olfert IM et al.DOI: 10.1113/JP284767
- Distribution of data in cellular electrophysiology: Is it always normal?Progress in biophysics and molecular biology · 2020Kula R, Bébarová M, Matejovič P et al.DOI: 10.1016/j.pbiomolbio.2020.05.008
- Descriptive statistics and normality tests for statistical data.Annals of cardiac anaesthesia · 2019Mishra P, Pandey CM, Singh U et al.DOI: 10.4103/aca.ACA_157_18
- Parametric or nonparametric statistical tests: Considerations when choosing the most appropriate option for your data.ReviewCytopathology : official journal of the British Society for Clinical Cytology · 2022Vrbin CMDOI: 10.1111/cyt.13174
- Do overactive bladder symptoms and their treatment-associated changes exhibit a normal distribution? Implications for analysis and reporting.Neurourology and urodynamics · 2020Amiri M, Murgas S, Stang A et al.DOI: 10.1002/nau.24275
- Rayleigh-half normal distribution for modeling tooth movement data.Journal of biopharmaceutical statistics · 2020Abd El-Monsef MME, Abd El-Raouf MMDOI: 10.1080/10543406.2019.1684312
- Determination of Normal Distribution of Distended Colon Volumes to Guide Performance of Colonic Imaging With Fluid Distention.ReviewCurrent problems in diagnostic radiology · 2016Zheng KS, Small WC, Mittal PK et al.DOI: 10.1067/j.cpradiol.2015.11.001
- Variability in the Log Domain and Limitations to Its Approximation by the Normal Distribution.CPT: pharmacometrics & systems pharmacology · 2020Elassaiss-Schaap J, Duisters KDOI: 10.1002/psp4.12507
via PubMed
Wikidata facts
- Subclass of
- continuous probability distribution
- Named after
- Carl Friedrich Gauss
- Image
- Normal Distribution PDF.svg
Show 8 more facts
- Stack Exchange tag
- stats.stackexchange.com/tags/normal-distribution
- facet of
- statistics
- Commons category
- Normal distribution
- topic's main category
- Category:Normal distribution
- TeX string
- \mathcal{N}(\mu,\,\sigma^2)
- definition domain
- set of real numbers
- on focus list of Wikimedia project
- Wikipedia:Vital articles/Level/4
- maintained by WikiProject
- WikiProject Mathematics
via Wikidata · CC0
Article · العربية
في نظرية الاحتمالات، التوزيع الطبيعي (أو الغاوسي) هو توزيع احتمالي مستمر كثير الانتشار والاستعمال، يستخدم - غالباً - تقريباً أولياً لوصف المتغيرات العشوائية التي تميل إلى التمركز حول قيمة متوسطة وحيدة. لمخطط تابع كثافة الاحتمال المقابل لهذا التوزيع شكل الجرس، ويعرف بالدالة الغاوسية أو منحني الجرس. حيث هو القيمة المتوقعة (مكان الذروة)، و هو التباين (قياس عرض التوزيع). عندما تكون قيم وسيطي التوزيع و فإنه يسمى التوزيع الطبيعي المعياري. يعد التوزيع الطبيعي التوزيع الاحتمالي المستمر الأساسي، نظراً لدوره في مبرهنة النهاية المركزية، كما أنه من أول التوزيعات المستمرة التي تدرس في مقررات الإحصاء الابتدائية. فوفقاً لمبرهنة النهاية المركزية، وتحت شروط معينة، فإن مجموع عدد من المتغيرات العشوائية بعدد منته من المتوسطات والتباينات يقارب توزيعاً طبيعياً بازدياد عدد تلك المتغيرات. ولهذا السبب، فإنه كثيراً ما يشاهد هذا التوزيع في الممارسة العملية، وهو يستخدم في الإحصاء والعلوم الطبيعية والعلوم الاجتماعية نموذجاً بسيطاً للتعامل مع ظواهر معقدة. على سبيل المثال، خطأ الملاحظة في تجربة ما، غالباً ما يتبع توزيعاً طبيعياً. كما يحسب باستخدام هذا الافتراض أيضاً. انظر إلى توزيع ستيودنت الاحتمالي وإلى توزيع كوشي وإلى . لاحظ أن لمتغير ذي توزع طبيعي توزيعاً متناظراً حول متوسطه. ولهذا فإن القيم التي تنمو بشكل أسي (كالأسعار والدخل وعدد السكان) تكون ملتوية نحو اليمين (skewness)، وبالتالي يمكن التعبير عنها بشكل أفضل باستخدام توزيعات أخرى، وتوزيع باريتو.
Abstract from DBpedia / Wikipedia · CC BY-SA
Gallery (12)
Available in 74 languages
- Español
- Français
- Deutsch
- 中文
- 日本語
- Русский
- Português
- Italiano
- العربية
- हिन्दी
- Albanian
- Albanian
- Armenian
- Asturian
- azb
- Azerbaijani
- Bahasa Indonesia
- Basque
Show 55 more
- Belarusian
- Bosnian
- Bulgarian
- Catalan
- Chuvash
- Croatian
- Czech
- Danish
- Esperanto
- Estonian
- Filipino
- Finnish
- Galician
- Georgian
- Greek
- Hebrew
- Hungarian
- Icelandic
- Irish
- Kazakh
- Latin
- Latvian
- Lithuanian
- Lombard
- Macedonian
- Malay
- Marathi
- Nederlands
- Northern Frisian
- Norwegian
- Norwegian Nynorsk
- Piedmontese
- Polski
- Romanian
- Serbian
- Serbian (Latin)
- simple
- Slovak
- Slovenian
- Sundanese
- Svenska
- Tamil
- Tatar
- Tiếng Việt
- Türkçe
- Ukrainian
- Urdu
- Welsh
- Wu Chinese
- Yiddish
- zh_min_nan
- zh_yue
- فارسی
- ไทย
- 한국어
via Wikidata sitelinks · CC0