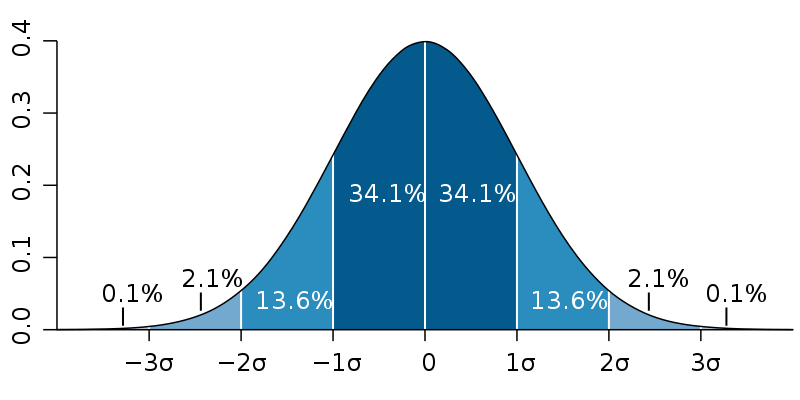
File:Standard_deviation_diagram.svg · Wikimedia Commons · See Wikimedia Commons
Standart sapma
Sign in to saveİstatistikte bir varyasyon ölçüsü
AI overview
Standard deviation measures how spread out the values in a group of data are from the average—essentially telling you whether the numbers cluster tightly together or scatter widely. It matters because it helps you understand whether an average is truly representative of your data or whether there's a lot of variation hiding behind that single number.
AI-generated from the Wikipedia summary — may contain errors.
Wikidata facts
- Instance of
- statistical dispersion
- Part of
- stochastic
- Image
- Standard deviation diagram.svg
Show 6 more facts
- Commons category
- Standard deviation
- Commons gallery
- Standard deviation
- facet of
- statistics
- short name
- SD
- on focus list of Wikimedia project
- Wikipedia:Vital articles/Level/4
- maintained by WikiProject
- WikiProject Mathematics
via Wikidata · CC0
Gallery (6)
Available in 80 languages
- Español
- Français
- Deutsch
- 中文
- 日本語
- Русский
- Português
- Italiano
- العربية
- हिन्दी
- Afrikaans
- Albanian
- Assamese
- Asturian
- Azerbaijani
- Bahasa Indonesia
- Bangla
- Basque
Show 61 more
- be_x_old
- Belarusian
- Betawi
- Bosnian
- Bulgarian
- Catalan
- cbk_zam
- Central Kurdish
- Chuvash
- Crimean Tatar
- Croatian
- Czech
- Danish
- Esperanto
- Estonian
- Filipino
- Finnish
- Galician
- Greek
- Hebrew
- Hungarian
- Icelandic
- Kazakh
- Latin
- Latvian
- Lithuanian
- Macedonian
- Malay
- Mongolian
- Nederlands
- Nepali
- Norwegian
- Norwegian Nynorsk
- Occitan
- Polski
- Romanian
- Samoan
- Serbian
- Serbian (Latin)
- Sicilian
- simple
- Sindhi
- Sinhala
- Slovak
- Slovenian
- Sundanese
- Svenska
- Swahili
- Tamil
- Tiếng Việt
- Türkçe
- Ukrainian
- Urdu
- Waray
- Welsh
- Wu Chinese
- zh_min_nan
- zh_yue
- فارسی
- ไทย
- 한국어
via Wikidata sitelinks · CC0